Reports in two steps
In this article I will show you how to add quickly and easily a simple but very nice report on the web page. Actions will be done in two simple steps — the design of the report and creating a simple web page to place the report on it. You can use any code editor and the demo package of Stimulsoft Reports JS that you can get at https://www.stimulsoft.com/en/downloads/reports-js.
The first step is designing a report template in the report designer. But for a more comfortable work (getting rid of the manual input of data structures) you still need to open a text editor, create the app.js file where we put all the code of our mini-project and add a few lines of code to the top.
Initialize the object with data:
var data = {
“States” : [{
“Name” : “Alabama”,
“USPS” : “AL”,
“Population” : 4779736,
“Capital” : “Montgomery”
}, {
“Name” : “Alaska”,
“USPS” : “AK”,
“Population” : 710231,
“Capital” : “Juneau”
}, {
“Name” : “Arizona”,
“USPS” : “AZ”,
“Population” : 6392017,
“Capital” : “Phoenix”
}, {
“Name” : “Arkansas”,
“USPS” : “AR”,
“Population” : 2916,
“Capital” : “Little Rock”
}, {
“Name” : “California”,
“USPS” : “CA”,
“Population” : 37253956,
“Capital” : “Sacramento”
}, {
“Name” : “Colorado”,
“USPS” : “CO”,
“Population” : 5029196,
“Capital” : “Denver”
}, {
“Name” : “Connecticut”,
“USPS” : “CT”,
“Population” : 3574097,
“Capital” : “Hartford”
}]
};
The dynamic manipulation with data is done by adding and removing objects in an array filled with lines-objects:
data.States.push({
“Name” : “Delaware”,
“USPS” : “DE”,
“Population” : 897934,
“Capital” : “Dover”
});
Let’s start to work with the report engine. It must be understood that the report is a complex object that contains not only the data layout but lots of related entities, one of which is a report dictionary. It is a collection of data sources described by the structure containing information on the columns. When rendering a report, data must be loaded into the dictionary, which then are output on the pages of the report.
Create the report object first and initialize it:
var report = new Stimulsoft.Report.StiReport();
Next, create a data set, initialize it, and name it. This name will appear in the report dictionary:
var dataSet = new Stimulsoft.System.Data.DataSet(“data”);
Load the newly created set of data from the object data, as previously described. To do this, use one of the methods that load data into the data source from the JSON object:
dataSet.readJson(data);
Register the data set in the report as a data source. This procedure links the set of data with the data dictionary, and, in this case, adds the created data set dataSet into the dictionary with the name and alias data:
report.regData(“data”, “data”, dataSet);
However, adding the data set in the report dictionary does not provide additional data structure and data in the dictionary. To do this, you must synchronize the connected data sources:
report.dictionary.synchronize();
Finally, on the page, we will see a report without editing capabilities but the report template is not created yet. So let’s do some trick and create a report in the embedded designer which we will delete after.
To do this, create a report designer object and initialize it, passing a set of display options (if you will use the default settings, you can simply specify null) as a parameter, designer ID and the flag of immediate drawing the component on the page:
var designer = new Stimulsoft.Designer.StiDesigner(null, “StiDesigner”, false);
Link the report with the designer:
designer.report = report;
And send a command to render the report designer, specifying as parameters the identifier of the HTML element that is responsible for the placement of components:
designer.renderHtml(“reportContent”);
In order this code to work, you have to create the start page index.html and add a few lines:
• To load the style which is responsible for displaying the report viewer, connect the CSS file with the default theme:
<link href=”../css/stimulsoft.viewer.office2013.css” rel=”stylesheet”>
• To load the style which is responsible for displaying the report designer, you need to connect the CSS file with the default theme:
<link href=”../css/stimulsoft.designer.office2013.lightgray.teal.css” rel=”stylesheet”>
• Scripts of the report engine, designer and viewer are connected with the following lines respectively:
<script src=”../scripts/stimulsoft.reports.js” type=”text/javascript”></script>
<script src=”../scripts/stimulsoft.viewer.js” type=”text/javascript”></script>
<script src=”../scripts/stimulsoft.designer.js” type=”text/javascript”></script>
• Then connect the file with our source:
<script src=”../scripts/app.js” type=”text/javascript”></script>
• And somewhere in the <body> in the right place, add <div> to display the required component:
<div id=”reportContent”></div>
You can now run the Web application. Any web server without the support of any technology is good for this purpose. Suitable even the built-in Python module. And, if everything is done correctly the report designer will appear in the web browser page with the data source and all of the data described in the code:

For the report, you must create a report template — layout for data, which will be filled from the code and display the information in a convenient and elegant form.
To simplify the procedure of the report design you can use the report wizard for which go to the menu item FILE –> NEW –> choose Standard Report:

The first page of the Report Wizard — selection of the the data source. Set the virtual data source here:

On the next page you should select all data columns:

Further steps are optional but can improve the appearance of the report. Set the order of columns (lines in the list can be moved by using arrows on the right):

And add sorting by name:

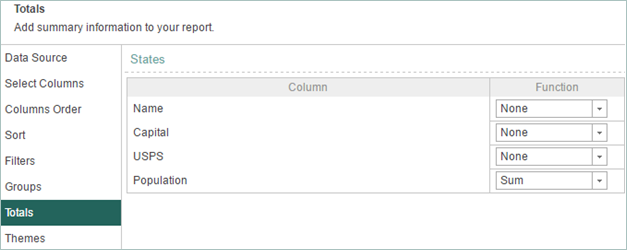
Let’s skip filtering and grouping but add total by the Population column:
Then select the theme you want and click Finish:

The generated report is ready for use but you must perform several actions to make it clearer. Add headers to columns:

Also, to the Population numeric field, let’s configure the format the digits shown without a decimal part, and add a signature to display the sum. Also, let’s change the width of columns to make it more suitable for our data.
At any time you can see the current result in the Preview tab:

When the report in finished, if we the result is quite good, we can save the report to a file (FILE — SAVE AS):

You can find it in your browser’s download folder. It’s time to move the report template (report.mrt) to the folder of the project.
The very first step is completed — the report template is created and ready to display data from an application. It remains only to put things in order — remove the designer scripts and code associated with this component, as it is planned to do not allow the user to change the report layout.
To do this, remove:
• the stimulsoft.designer.js file from the scripts folder;
• references to the CSS and the designer script from the index.html file:
<link href=”../css/stimulsoft.designer.office2013.lightgray.teal.css” rel=”stylesheet”>
<script src=”../scripts/stimulsoft.designer.js” type=”text/javascript”></script>
• From the app.js file, remove the code responsible for the initialization and calling the report designer:
var designer = new Stimulsoft.Designer.StiDesigner(null, “StiDesigner”, false);
designer.report = report;
designer.renderHtml(“reportContent”);
Well, it is time for the second step which will be much shorter than the first — writing code to display the data in the rendered report template.
To do this, connect the rendered report to our application. Let’s add the code of initialization report with a couple of lines:
var report = new Stimulsoft.Report.StiReport();
Load the previously rendered report template into our report:
report.loadFile(“../reports/report.mrt”);
Since the template contains a data dictionary, then clear the dictionary:
report.dictionary.clear();
The rest of code to work with the data is already written (the creation of a set of data, uploading and data synchronization):
var dataSet = new Stimulsoft.System.Data.DataSet(“data”);
dataSet.readJson(data);
report.regData(dataSet.dataSetName, dataSet.dataSetName, dataSet);
report.dictionary.synchronize();
It remains only to display the report viewer. There is a special object StiViewerOptions to customize the viewer functionality, including various options. As a demonstration, let’s initialize this object and enable in the main report, the export function to MS Office files:
var options = new Stimulsoft.Viewer.StiViewerOptions();
options.exports.showExportToWord2007 = true;
options.exports.showExportToExcel2007 = true;
Then, let’s create an object of the report viewer and initialize it passing a set of display options as a parameter (if you will use the default settings, you can simply specify null), the viewer ID and the flag to immediately output the report on the page:
var viewer = new Stimulsoft.Viewer.StiViewer(options, “StiViewer”, false);
Bind the rendered report to the viewer:
viewer.report = report;
And set the command to rendering the report, specifying as parameters the identifier of the HTML item which is responsible for placing the viewer:
viewer.renderHtml(“reportContent”);
As a result, we get the report on the page created in the first step and the data collected in the second step.

As you can see, two simple steps is really enough to display a report of any complexity on the web page.
The functionality of Stimulsoft Reports.JS is not limited by simple reports that use the application data. Using the report designer you can build really complex multi-component reports with business graphics and the data sources can be large amounts of data from a database, files, and online services, transmitted directly to the report.
All resources and the application code described in this article can be found in the repository!